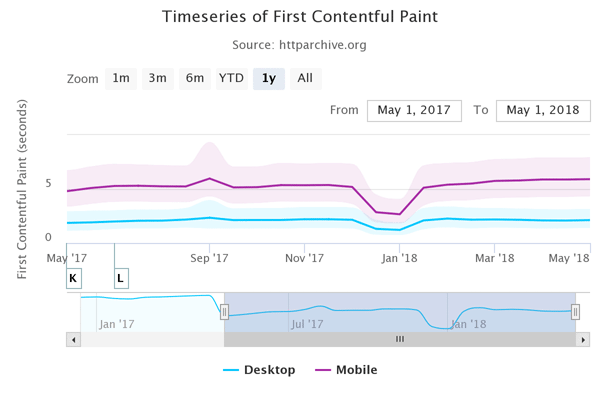
Web Less Mobile Friendly in 2018 than 2017

A comparison of mobile speed metrics of the Internet from 2017 to 2018 reveals that websites are less mobile friendly today than they were a year ago. This is bad for the Internet. But it can be good news for you.
HTTPArchive is a sister project of Archive.org. Archive.org takes snapshots of almost the entire Internet and keeps a permanent record of it. HTTPArchive records the performance statistics of those websites.
Responsive is Not Always Mobile Friendly
Google has been warning web publishers of their mobile friendly index and publishers have raced to make their sites mobile friendly. While anecdotally it may seem that most sites are responsive and render in mobile devices, the surprising fact is that most sites are less mobile friendly.
First Contentful Paint
First Contentful Paint is the metric that measures how many seconds pass from the time a user navigates to a page until the main content is available to be consumed by the site visitor.
According to HTTPArchive.org, the median average number of seconds it takes before a user can use a mobile site is 5.9 seconds. That represents an increase of 22.9%.

Time to Consistently Interactive
This metric measures how long it takes from the moment a site visitor navigates to a web page until the page is fully useable and interactive. The amount of time the average site visitor needs to wait is 14.6 seconds. This represents a 20.7% increase over 2017.
This metric reveals the surprising amount of time mobile sites visitors need to wait for a single web page. While the next web pages may take less time to download, there will be less visitors to visit those other pages. Many visitors abandon a web page if it fails to download fast enough. View metric here.
Why are Mobile Friendly Sites Less Mobile Friendly?
To answer this question you have to review the data in detail. Here’s a quick breakdown:
JavaScript Weight
The average weight of JavaScript files increased by 50.1%
CSS Weight
The average weight of a CSS file has increased by 36.8%
HTML Weight
The average weight of the HTML needed to create a web page increased by 117.5%
Font Weight
The average weight of the font downloads has increased by 18.3%
Image Weight
The average weight of images, measured in bytes, increased by 13.9%
Across every important metric, web pages are less mobile friendly in 2018 than in 2017. And this could be good news for you.
Why these Metrics Matter
According to Google:
…it was found that sites loading within 5 seconds had 70% longer sessions, 35% lower bounce rates, and 25% higher ad viewability than sites taking nearly four times longer at 19 seconds.
Additionally, the speed of a site affects earnings and sales. Here’s what Google’s data has shown:
“Slow sites have a negative impact on revenue, and the opposite is also true.
For Mobify, Every 100ms decrease in homepage load speed worked out to a 1.11% increase in session-based conversion, yielding an average annual revenue increase of nearly $380,000. Additionally, a 100ms decrease in checkout page load speed amounted to a 1.55% increase in session-based conversion, which in turn yielded an average annual revenue increase of nearly $530,000.”
Takeaway: Poor Performing Competition Can be Your Strength
One of my rules for competition analysis is to identify competitor weaknesses and consider making those your strength. Whether you are a big brand or a nimble mom and pop, improving your page speed is a useful way to improve sales and possibly improve your rankings.
